


About the Flood Hazard Maps and the Flood Risk Maps
The scope of flood hazard maps
The scale and form of FHM and FRM development
The use of flood hazard maps and flood risk maps
LEGAL BASES
Flood hazard maps (FHM, Polish abbreviation “MZP”) and flood risk maps (FRM, Polish abbreviation “MRP”) are prepared on the basis of the following legal acts:
- Directive 2007/60/EC of the European Parliament and of the Council of 23 October 2007 on the assessment and management of flood risks (Flood Directive);
- Water Law Act;
- Regulation of the Minister of Marine Economy and Inland Navigation of 4 October 2018 on the development of flood hazard maps and flood risk maps (Journal of Laws of 2018, item 2031).
Pursuant to Article 171 section 9 of Water Law Act, which provides that the State Water Holding Polish Waters, in agreement with competent voivodes, are responsible for preparing projects of flood hazard maps and flood risk maps for fluvial flood and floods from the dam failure). While projects of maps of floods from the sea are developed by the directors fo Maritime Offices.
FHM and FRM are approved by the Minister respospible for water managment and published, by placing them in the Public Information Bulletin.
Flood hazard maps are prepared for Areas of Potencial Significant Flood Risk (areas where the risk is confirmed and likely to occure), identified in Preliminary Flood Risk Assessment (PFRA).
The Flood Directive provides that flood hazard maps and flood risk maps are reviewed and, if necessary, updated every 6 years cycles in connection with the need to assess changes in flood risk and the need to plan and implement measures to reduce the negative consequences of floods for human health, environment, cultural heritage and economic activity.
The Water Law Act (art. 169-170) specifies the general scope of FHMs and FRMs. However, the specific scope and requirements for the development of flood hazard maps and flood risk maps, as well as the scale, are determined by the Regulation.
DEFINITIONS
Flood – the temporary covering by water of land not normally covered by water, in particular caused by rivers, reservoirs, canals and the sea, excluding floods from sewerage systems.
Flood hazard – the possibility of flooding in an area with a certain probability.
Flood risk – the combination of the probability of a flood event and potential adverse consequences for human health and life, the environment, cultural heritage and economic activity.
Areas of potential significant flood risk – areas indicated in the preliminary flood risk assessment, for which the potential significant flood risk exist or is likely to occur.
Flood hazard areas – areas which could be flooded with a certain probability or as a result of an extreme event, presented on flood hazard maps.
Special flood hazard areas are:
- areas where the probability of flooding is medium (1%),
- areas where the probability of flooding is high (10%),
- areas between the shoreline and the embankment or natural high with built-in flood embankment, as well as islands and alluvials, which constitue cadastral parcels,
- technical pelt of the seashore which forms the zone of mutual direct influence of the sea and the land.
THE SCOPE OF FLOOD HAZARD MAPS
Flood hazard maps include the areas with a certain probability of flooding:
- areas where the probability of flooding is low, which corresponds to 0.2% (once every 500 years), or extreme event scenario;
- areas where the probability of flooding is medium, which corresponds to 1% (once per 100 years);
- areas where the probability of flooding is high, which corresponds to 10% (once per 10 years);
- areas exposed to flooding in the event of:
4.1 the flood embankment failure - estimated for the flow with the 1% probability of occurrence;
4.2 the dam failure
In addition, flood hazard maps shall include:
- water depths;
- the flow velocity and direction of water flow (for cities with poviat rights);
in the classes defining the level of risk for people and the way of impact on buildings, in accordance with the Regulation:
- water depths:
- h ≤ 0.5 m – low hazard to people and buildings;
- 0.5 m < h ≤ 2 m – medium hazard to people (possibility of evacuation to upper floors of buildings) but high damages;
- 2 m < h ≤ 4 m – high hazard to people and ver high damages;
- h > 4 m – very high hazard to people and very high or total damages;
- flow velocity:
- v ≤ 0,5 m/s – low velocity; water has a small impact on buildings;
- 5 m/s < v ≤ 1 m/s – medium velocity; water has a moderate impact on buildings, is a threat to people;
- 1 m/s < v ≤ 2 m/s – high velocity; water has a big impact on buildings, is a serious threat to people;
- v > 2.0 m/s – very high velocity; water has a very big impact on buildings, may damage structures of static objects, is a very serious threat to people.
|
In accordance with the regulation, cartographic versions of flood hazard maps are prepared separately for each scenario in two thematic sets:
Flood hazard maps do not show the historical floods extent, but present areas with a certain probability of flooding. To determine flood hazard areas, the maximum flow with a given probability of occurrence is used (calculated on the basis of maximum annual flows from the period of at least 30 years). The 1% probability of flooding means that statistically such a flood may occur once every 100 years. However, it should be noted that this is a statistical value and does not mean that flooding with the probability of 1% occurs at 100 years intervals. In fact, every year there is a possibility of 1:100 occurrence of at least one flood. In the Kłodzko Valley catastrophic floods occurred in 1997 and 1998. In the summer of 2010, in the Carpathian Mountains, one hundred year flood happened twice, and in addition two smaller floods. Flood hazard areas are determined using geographic information systems, on the basis of water surface elevation calculated using the hydraulic model. The The digital terrain model (DTM) and the digital land cover model are used to determine flood hazard areas. DTM comes from airborne laser scanning (LIDAR), with the vertical accuracy of < 20 cm and spatial resolution of 1 m. |
|
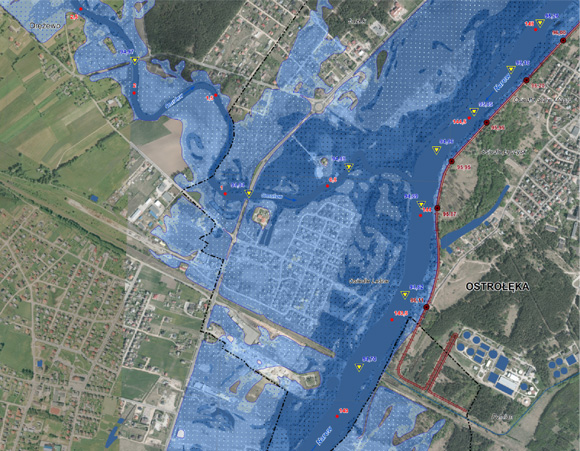 Flood hazard maps with water depth Flood hazard maps with water depth |
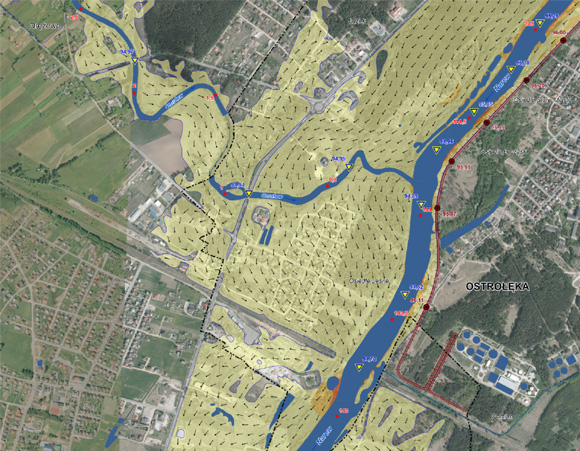 Flood risk map with flow velocity Flood risk map with flow velocity |
THE SCOPE OF FLOOD RISK MAPS
Flood risk maps are prepared for areas included in flood hazard maps.
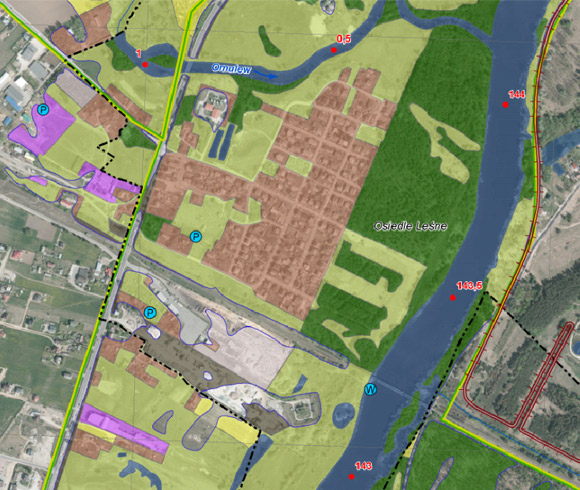
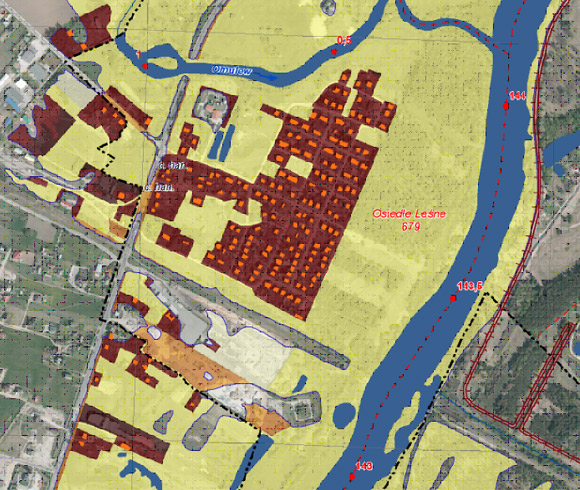
Flood risk maps show the potential adverse consequences of flooding for human health and life, the environment, cultural heritage and economic activity. Flood risk maps present objects important from the point of view of flood protection and information necessary to assess flood risk and potential consequences of flooding.
For this purpose, flood risk maps include, in particular:
- Indicative number of inhabitants potentially affected;
- Residential buildings and objects of social importance in the flood hazard area i.e. schools, kindergartens, nurseries, hotels, resorts, educational care facility, shopping and service centre, hospitals, social care centres, nursing home, hospices, penitentiary, correctional or custodial facility, police stations, fire stations, border guard;
For each building there is an estimation of the average depth of flooding separately for each flood scenario, classified in two ranges:
- water depth < 2 m,
- water depth > 2 m.
determining the degree of threat to the population and building;
3.Types of economic activities in flood hazard areas are defined by land use classes:
- residential areas,
- industrial areas,
- transportation areas,
- forests,
- recreational areas,
- arable lands,
- grasslands,
- surface water,
- other areas;
4.Cultural heritage areas and buildings;
5. Installations that, in the event of floods, may cause significant pollution to some parts of the environment or the environment as a whole (IED):
- installations where an integrated permit is required, as specified in the Environmental Protection Law, in the following categories of industrial activities: energy industry, metallurgical industry, mineral industry, chemical industry, waste management, other types of activities, including manufacture and processing of paper and wood, intensive farming or breeding of pigs and poultry, manufacture and processing of plant and animal resources;
- industrial plants that do not require the permit referred above, but which may may cause major industrial accident hazards (Seveso);
6. Protected areas:
- water abstractions (surface and groundwater) – including drinking water,
- abstraction protection zones,
- bathing waters (Directive 76/160 / EEC),
- Natura 2000 sites,
- national parks and nature reserves,
- zoos;
7. Other potential sources of water pollution in case of flooding including wastewater treatment plants, wastewater pumping stations, landfills, cemeteries;
8. The value of potential flood losses for land use classes.
In accordance with the Regulation, cartographic versions of flood risk maps are prepared separately for each flood scenario in two thematic sets:
- Flood risk map – potential adverse consequences for human health and life and the values of potential flood damages,
- Flood risk map – potential adverse consequences for the environment, cultural heritage and economic activity,
|
|
THE SCALE AND FORM OF FHM AND FRM DEVELOPMENT
FHM and FRM are developed in digital form as:
- spatial database and
- cartographic version (in pdf and geotiff files), divided into sheets correspoding to cartographic map sheets in scale 1:10 000.
Spatial database includes vector layers in shapefile form, that are a basis for conducting spatial analysis in GIS systems.
Cartograpfic versions of maps in pdf form are a complete version with legend, ready to print, but version in geotiff form includes only a content of a map, which allows to use it as an input to use in GIS systems.
THE USE OF FLOOD RISK AND FLOOD HAZARD MAPS
Flood hazard maps and flood risk maps constitute the basis for the development of flood risk management plans, including a sets of technical and non-technical measures, which aim to reduce the adverse consequences of flooding.
Knowledge about flood hazard and flood risk is extremely important, as it contributes to the proper spatial planning and development, thus reduction of the adverse consequences of flooding. Flood hazard areas presented on FHMs are taken into account in spatial planning documents. As a result, residents and local authorities can make informed and responsible decisions concerning the location of investments.
Maps can be starting point for further analyses needed to implement different administrative tasks, including crisis management in case of flooding.